Correction Accelerates After Losing Key Level
We lost the key 297/298 level highlighted last week and it has been persistent weakness in the broader indexes since. All large corrections start as small corrections so where we go from here remains to be seen. The key to me is for the names on my watchlist to show relative strength, build patterns, and not get hit with major distribution. If that happens, when the correction ends they should ignite higher. However, if the indexes stay persistently weak my best bet is that it will pull down even the strongest stocks or at least prevent them from having sustainable moves higher. I am embracing this index pullback to create new setups but remain cautious with the understanding that it may just be getting started. Nobody knows.
QQQ Daily- Exhaustion Extension on 2/2. Followed by Wedge Drop on 2/16, 2/17. EMA Crossback on 2/23. The down cycle is strong and if we follow the steps we have a Base n Break and Reversal Extension next. Into the 200SMA Friday but currently zero signs of healthy action to me. Would need to see support, basing/tightening under the 20EMA, and a new Wedge Pop or caution is warranted. We are in a daily downtrend below the 5, 10, 20 Day EMAs. That is a fact.
QQQ 65 Min-Four unfilled gap downs=weakness. We had the Wedge Drop, followed through down on 297/298, and then was rejected at the 20EMA to confirm the Crossback. From here, I see some potential scenarios.
A. Rally up and continue to be rejected at the 20EMA
B. Rally up, tighten under the 20EMA, build a base, and take out the 20EMA. (New Wedge Pop to change trend. We will need basing.)
C. Continuing straight lower. The trend is your friend.
NVDA Weekly-Strong reaction to earnings creating a bullish engulfing bar. We do have a broadening resistance line to make note of.
NVDA Daily- Further weakness in the market would be a good thing to help better set up a post-EPS flag. Want to see something like the below diagram without any major distribution. To be objective, an argument could be made that this is the 2nd extension on the move from 150. Not currently involved so just seeing if we get a new setup here or not.
TSLA Weekly- Three weeks of tightening action with constructive light volume last week after four weeks of heavy accumulation. Still have concerns there is no higher low on the weekly but the stock is showing relative strength to the index.
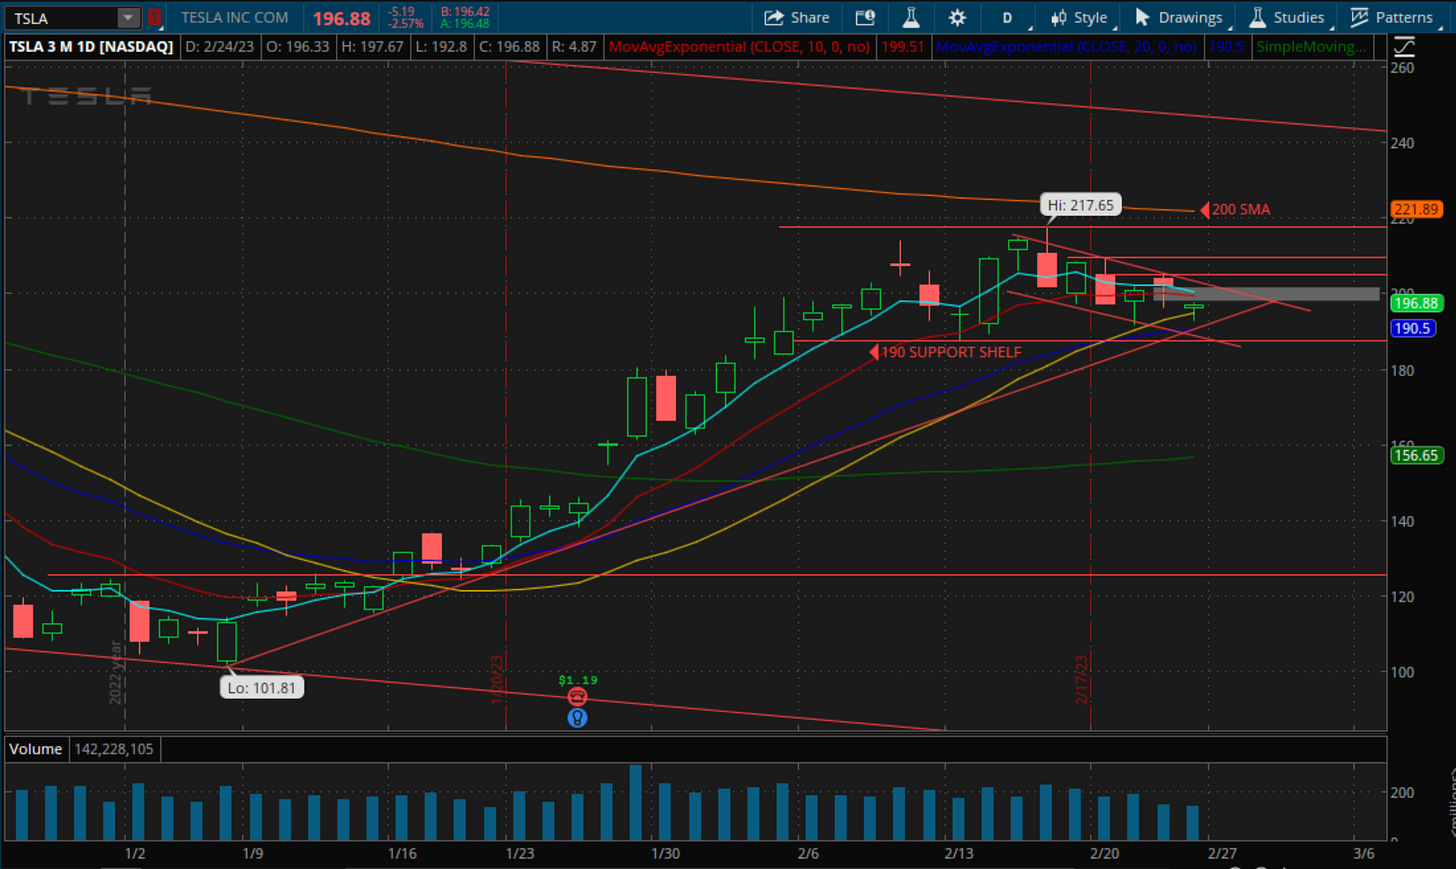
TSLA Daily- Consolidating into the 20EMA and holding above this 190 support shelf. As long as we stay above the 20EMA it may be building cause for a new move higher. 205/210 are the short term pivots above.
TSLA 65 MIN-If indexes were to get weaker there is potential TSLA fails this 190/192 area. Short term we have lower highs and near-term rejections on attempts higher. The AVWAP from the earnings gap up lines up perfectly with the 20EMA at 192. Would like to fill this gap down from Friday quickly. Just pointing this out to be aware.
PANW Weekly- Clearing the weekly trendline and descending wedge on heavy volume.
PANW Daily- A few days of backing and filling to let the moving averages catch up could set a better post-EPS bull flag.
ABNB Weekly- Consolidating the move from 90-140 into earnings. Light volume last week after heavy volume on the report. Above 130=good. Below 130=Patience
ABNB Daily- Doji into the Daily 20EMA and gap fill Friday. Support at this level will likely require more positive index action. Aggressive traders might try it here. It is not my main focus so will wait for greater confirmation if we find support. Maybe something like the below?
GFS Monthly- Two more trading days in the month. 69 and 72 are key levels above. Continuing to track because of the potential in this monthly. Currently, this tail is similar-ish to March so we will see if it can put up a fight.
GFS Daily- 66 is the first challenge. If we got through there that 2/21 bar may prove to be a knockout bar. Losing 62.50 and that trendline could lead to more selling. Planning to wait for greater confirmation here too. Some potential scenarios drawn below.
MELI Weekly- Strong earnings report this past week and in a better market it might have moved higher. 1165, 1195 and 1235 the upside levels. If the indexes maintain weakness would like it to continue to consolidate above the 10 Week.
TMDX Weekly- Breaking out on massive volume with an exceptional earnings report. Tough trader but looks good for higher prices.
ALGM Weekly- Further market weakness would do wonders to establish a new buy area in ALGM. A few weeks basing could set it up again. Healthy consolidation currently. ACLS STM two other semis consolidating strong moves.
NRDS Weekly- Strong stock. Continuing to track it as it builds the right side.
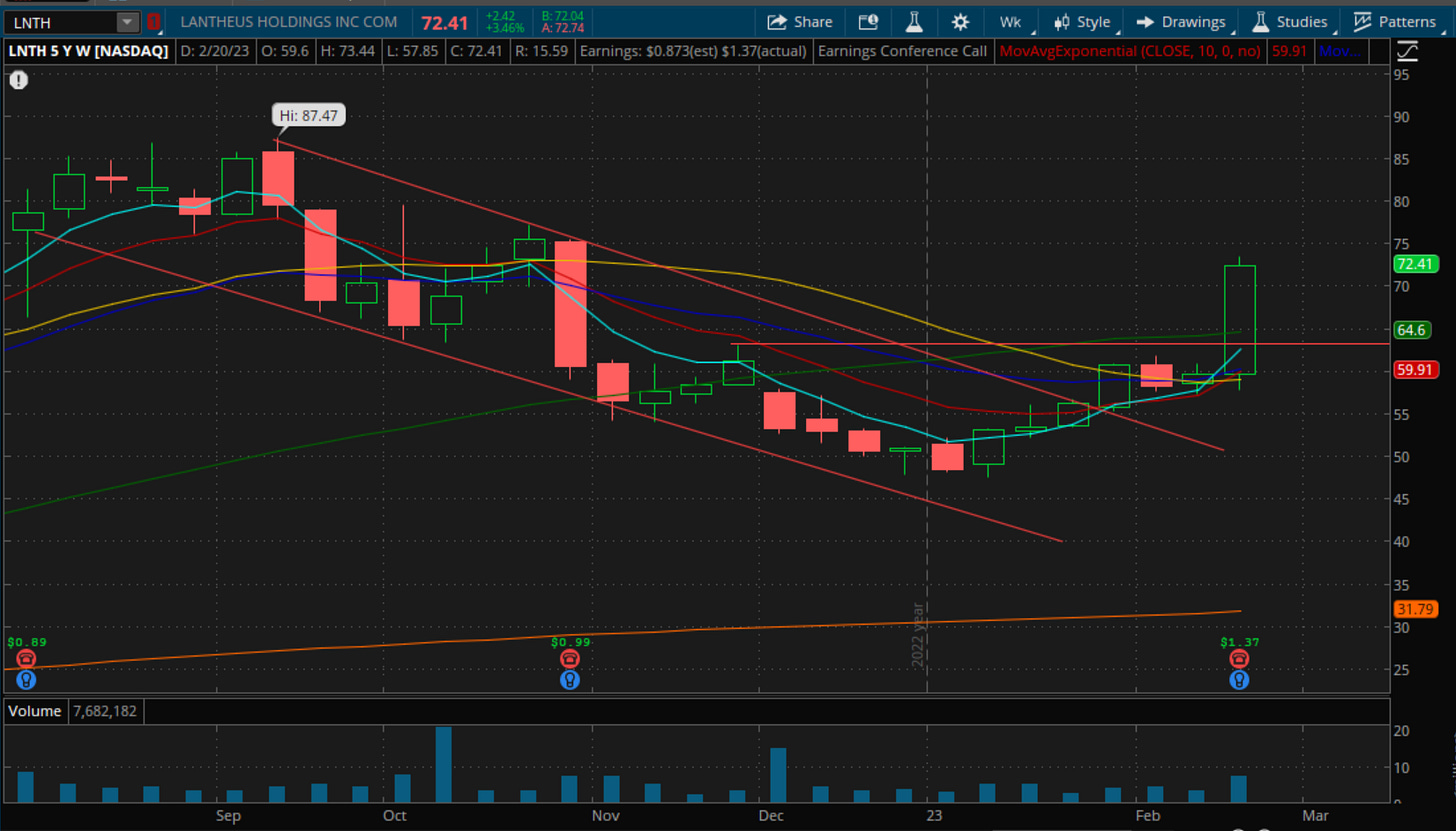
LNTH Weekly- Strong breakout of this descending channel through the Daily 200SMA. Letting it trade and set an easier buy area on the daily chart.
INTA Weekly- Strong stock. Short term extended but seeing if it can build a handle on the weekly chart here as we enter the turbulence zone.
LULU Weekly- Large head and shoulders top basing on the 200 Week SMA and this trendline from the Covid lows.
LULU Daily- Relative weakness since the December gap down. 306, 301.80 are shorter term pivots. Losing the 289.50 heavy volume support level would really open up this stock up to more downside.
Earnings of Note
2/28: BLDR- Large weekly cup building a weekly bull flag.
3/1: YOU- Consolidating under $35 since December. Still needs that “change of character” breakout to put it in play.
3/2: AI- Continues to consolidate the massive volume from early February. A strong earnings report should show if this is for real or not.
3/2: IOT- Developing potential double bottom building under 17.50/17.65. Still needs heavy volume “change of character” breakout to put it fully in play.


