From Failed Moves Come Fast Moves
After holding the 20 Week EMA and triggering a daily time frame buy signal markets looked setup for higher prices heading into last week. However, we failed that buy signal and triggered a sell signal Thursday. With the second largest bank failure in US history in the books and CPI this coming Tuesday a defensive posture seems prudent. If we saw rising inflation combined with contagion from this banking situation it would setup a very risky scenario (not saying that happens but possible). Treasuries rallied strongly Friday as a flight to safety and further weakness in yields might now be interpreted negatively.
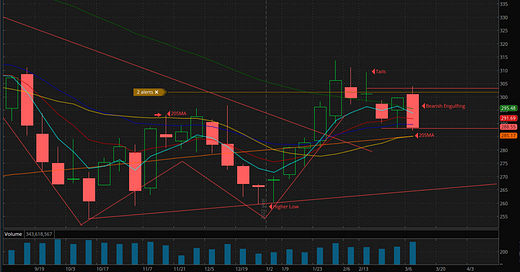
QQQ Weekly- Bearish engulfing. The 20SMA Weekly has been a level of relevance but with the three previous weekly tails I am cautious for a further break lower as the Nasdaq continues to consolidate bigger picture.
QQQ- Closing on 288 support after a 295 sell signal. Will be watching 5/10 day to resist any short-term rally. If we lose this 288 level it will be a definitive loss of Support, 50SMA, 200SMA, and the 20 Week EMA.
SPY Weekly- Bearish engulfing losing the rising trendline. The 200 Week held price on the lows and lines up with the next horizontal support level around 375.
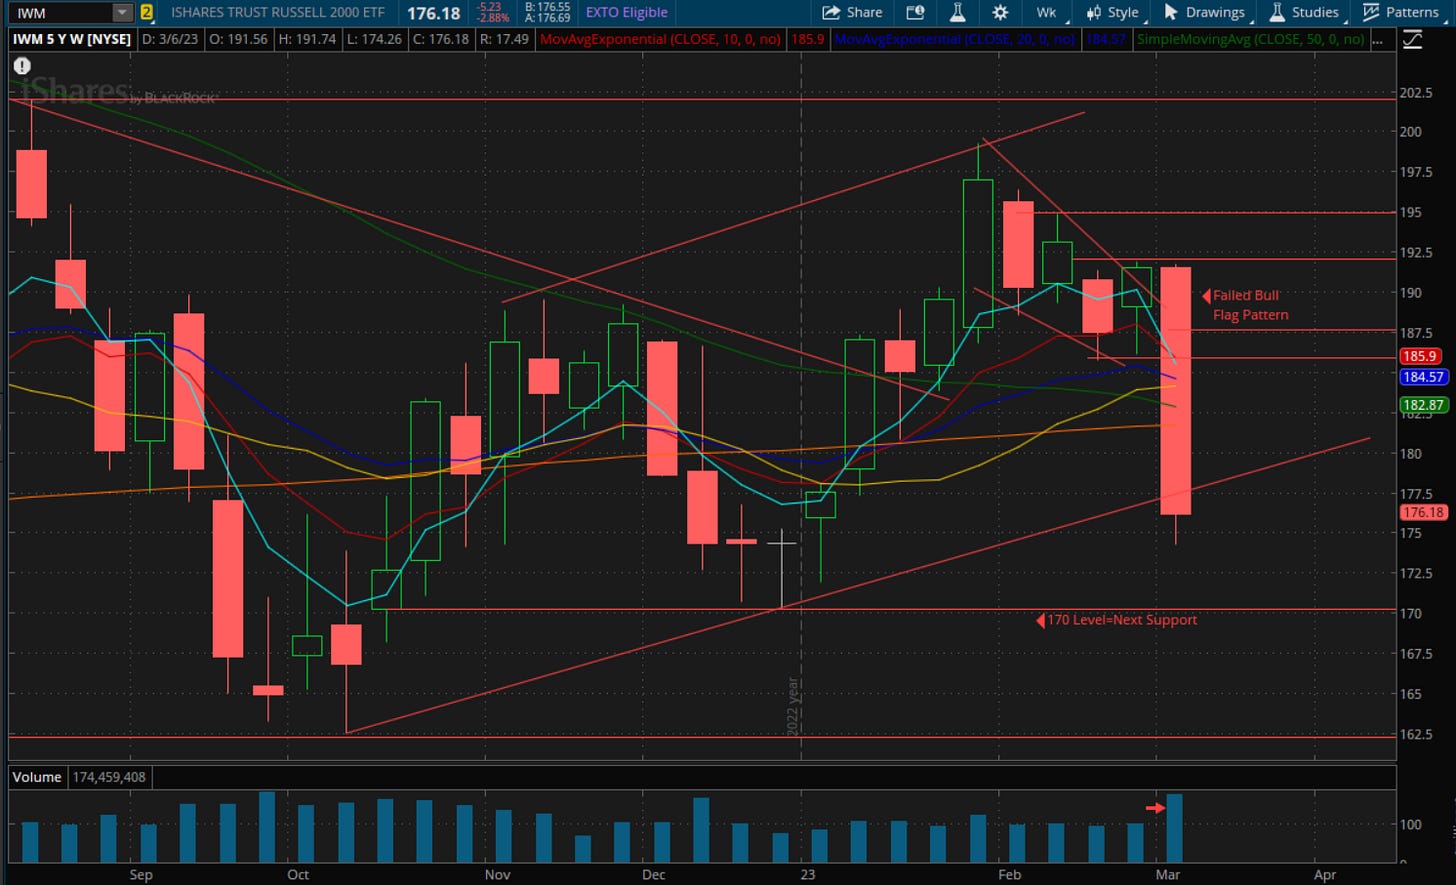
IWM Weekly- Failed weekly bull flag. Huge distribution bar and not a good sign. 170 next support level.
KRE Weekly- Breakdown on enormous volume this past week in the regional breaks. Will this prove to be a washout or do we see downside follow through over the next few weeks? Downside follow through would be a huge risk off sign to me.
NASI Daily- Accelerating down similar to mid-September. Four more weeks of negative breadth followed. Ominous sign that the January scenario is likely off the table. I look for this to turn black with confirmation over the 10EMA (blue) and we are heading the opposite direction.
TSLA Daily- Trending lower since losing the head and shoulders top. 285 is the near-term resistance level and will be looking at rallies up into the 5/10 day as shorting opportunities.
NVDA- Losing the short-term wedge pattern and now sitting on the 20EMA/rising trendline from the 150 buy area. 224.32 is the structural higher low. Could fill this gap on a break lower.
SNOW Weekly- Losing a daily bull flag Thursday. This looks set up to breakdown on the weekly time frame through the 120 area over time.
If the regionals saw further stress I am going to be focused on finding rallies to fade in the larger cap financials. They are currently stretched down on the daily time frames but the weeklies look to be putting in lower highs. MS GS shown below.
MS Weekly
GS Weekly
PXD Weekly- Weakest of the oils. Worth reviewing.
I will be tracking relative strength and building a list if we continue to see selling but have no interest in fighting this tape at the current moment. An important line to remember that I learned from my Dad….”It’s better to be out and want in than in and want out.” Good luck.


