Market at an Inflection Point?
With this letter I want to post my high-level thoughts on the market each month so I can reference back to it throughout the month. I generally trade growth stocks so will be trying to find the key new names, tracking other sectors doing well, the indexes, and whatever else looks like it is setting up a larger pattern.
The weekly charts of many of the indexes held what could be a potential higher low. This was a strong move with very positive price action and improving breath numbers showing many stocks are starting to participate higher. We have had three waves down in the indexes, from my perspective, but remain in a consolidation. The key will be to breakout through the descending channel trendline, firmly take out the 200SMA Daily in all the indexes, and have broader stocks pushing higher and out of proper buy areas. Many daily charts could be viewed as short term extended (daily) but the weeklies may just be getting ready to go. In a perfect world we would get some pullback on the daily to set things up tight and inside next week and give some stocks some rest. They could easily just continue higher.
SPY Weekly-three waves of selling off the highs. Potential to be putting in first higher low since the bear market began. With that said, confirmation of a higher high with a break and hold of the 410/412 area.
QQQ Weekly-the most beat up of all the indexes as tech took the brunt of the bear market. Continuing to lag since the October lows and is the furthest from attacking its 200 SMA on the daily time frame. Higher low and looking to take out 20 week and attempt to turn the trend.
IWM Weekly-The Russell 2000 was the weakest index at the beginning of the bear market and has been the strongest index since the October lows. It held an equal low on the October bottom whereas other indexes had clear undercuts. It has now already taken out its 200 SMA, on the daily timeframe, and is the first index to potentially make a higher high above the 190 area.
HYG Weekly-high yield bonds are at the mid December pivot highs and could be setup to make a higher high in the coming weeks. This would be a good risk on sign to monitor.
TNX Monthly (Ten Year Yield)-The monthly chart of the ten year yield shows how we exploded out of a long term channel that actually started in the early 1980s (only the last 25 years shown below). When we cleared the 3.25% area it confirmed a break above horizontal resistance and a true trend change. Currently, the 10 year yield has been pulling back on lower timeframes and this may be a partial reason for the better performance of the equity markets. Looking at the monthly, this currently looks like a pullback in an uptrend that has the chance to resume. Whether that happens or not and whether that is bad for equities or not remains to be seen. The Fed has forecasted higher rates for longer but inflation has started to come down and their forecasted rate hikes are slowing. I just show the chart to monitor it more than anything else.
NASDAQ McClellan Oscillator-in the short term we are at extremely overbought levels and may need some consolidation or pullback. With that said, this is a positive intermediate term sign to me in that this is the highest reading since the bear market began and could be a sign of future strength to come. To me, this would better be used by tracking divergences than as a straight up overbought indicator. You will notice on the lows NAMO put in a higher low on 12/28 as the QQQ put in a lower low. A rally then followed.
FSLR Weekly-exploding out of this weekly bull flag. May be a name to watch on pullbacks.
ARRY Weekly-nice consolidation with three higher lows off the bottom. You can also see a large inverse head and shoulders pattern going back to April of 2021. A definitive break of the 24 level triggers the pattern.
SHLS Weekly-another solar stock with positive price action this past week as it continues to build out its longer-term pattern.
MAXN Weekly- consolidating 2+ years with better price action as of late. It shows a similar inverted head and shoulders pattern to ARRY back to April of 2021. It needs some time to develop on the daily time frame with 24.38 and 28 being the near-term pivots.
ARHS Weekly- monstrous explosion this past week on heavy volume as it builds right side of this IPO base. Some people say it could be the next RH.
CRDO Weekly- explosive week as it continues to build a constructive first pattern. 15.30 to 15.50 is a key area of significance as this develops.
FLNC Weekly-coming onto my radar on 12/13 with its monster bull snort. It pulled back but then exploded again this past week with five straight days of above average volume. Could be a potential new leader.
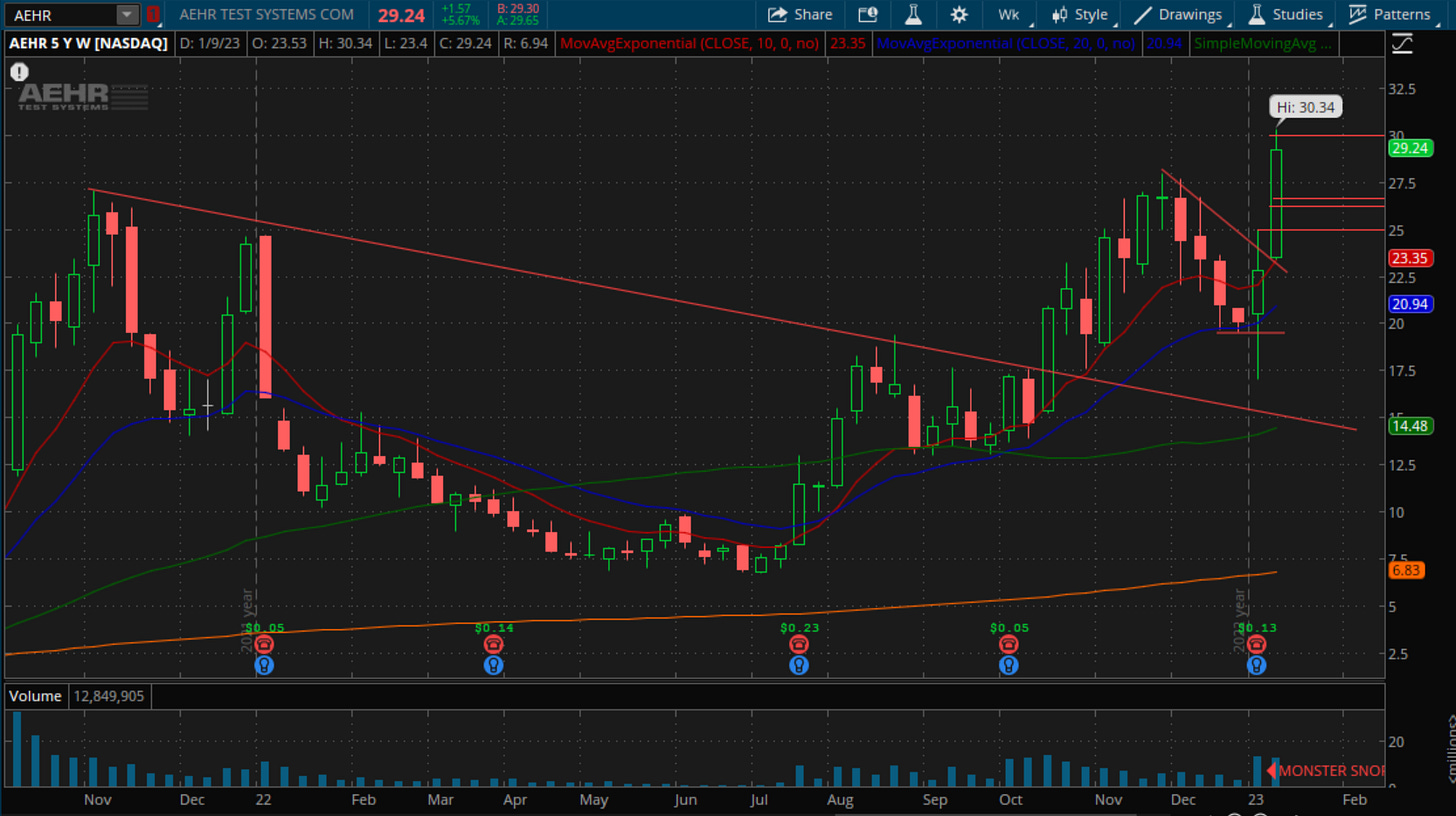
AEHR Weekly- explosive volume after reporting earnings on 1/6 . This is a very popular stock that was one of the few names trying to buck the trend of the index bear market. Short term extended but one to monitor for an entry.
LTH Weekly-another young IPO name that exploded this past week with five straight days of large volume. Although all gym stocks did well, and this is strictly based on personal experience, I think LTH is the one that has unique future leader potential.
TMDX Weekly-rallying for nearly all of 2022 with its second consolidation since blasting through $35. Continues to look promising heading into 2023.
TMCI Weekly- breaking out through the $25 level this past week. Looking for follow through.
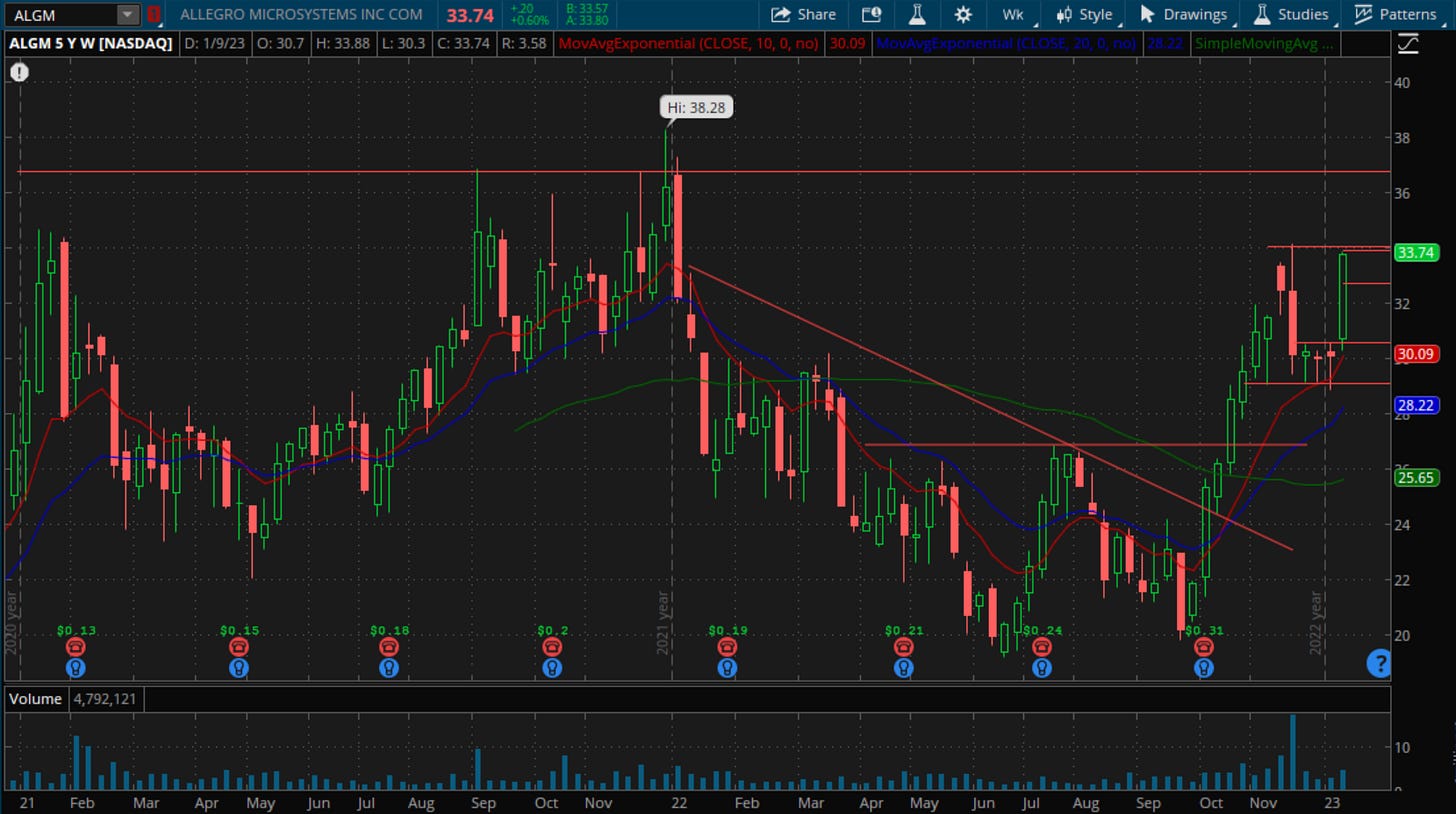
ALGM Weekly-younger semiconductor name outperforming off the October lows.
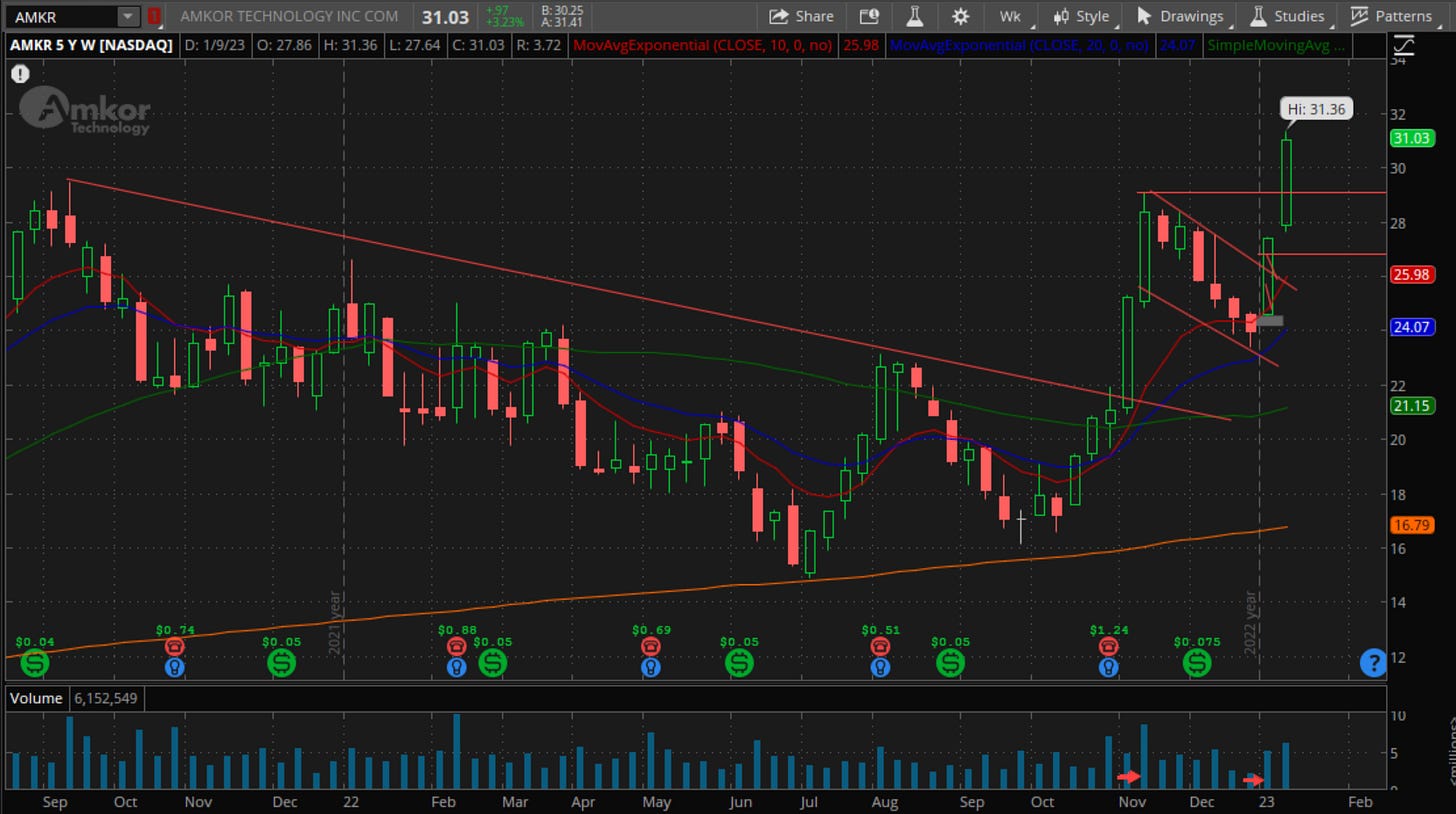
AMKR Weekly-significantly outperforming since October lows and looks constructive going forward. With two explosive weeks higher it is extended short term but may provide future entries.
CELH Weekly-second flag/handle on the right side of this cup pattern. Base on base like price action. Cleared $110 into the end of the week. Looking for follow through.
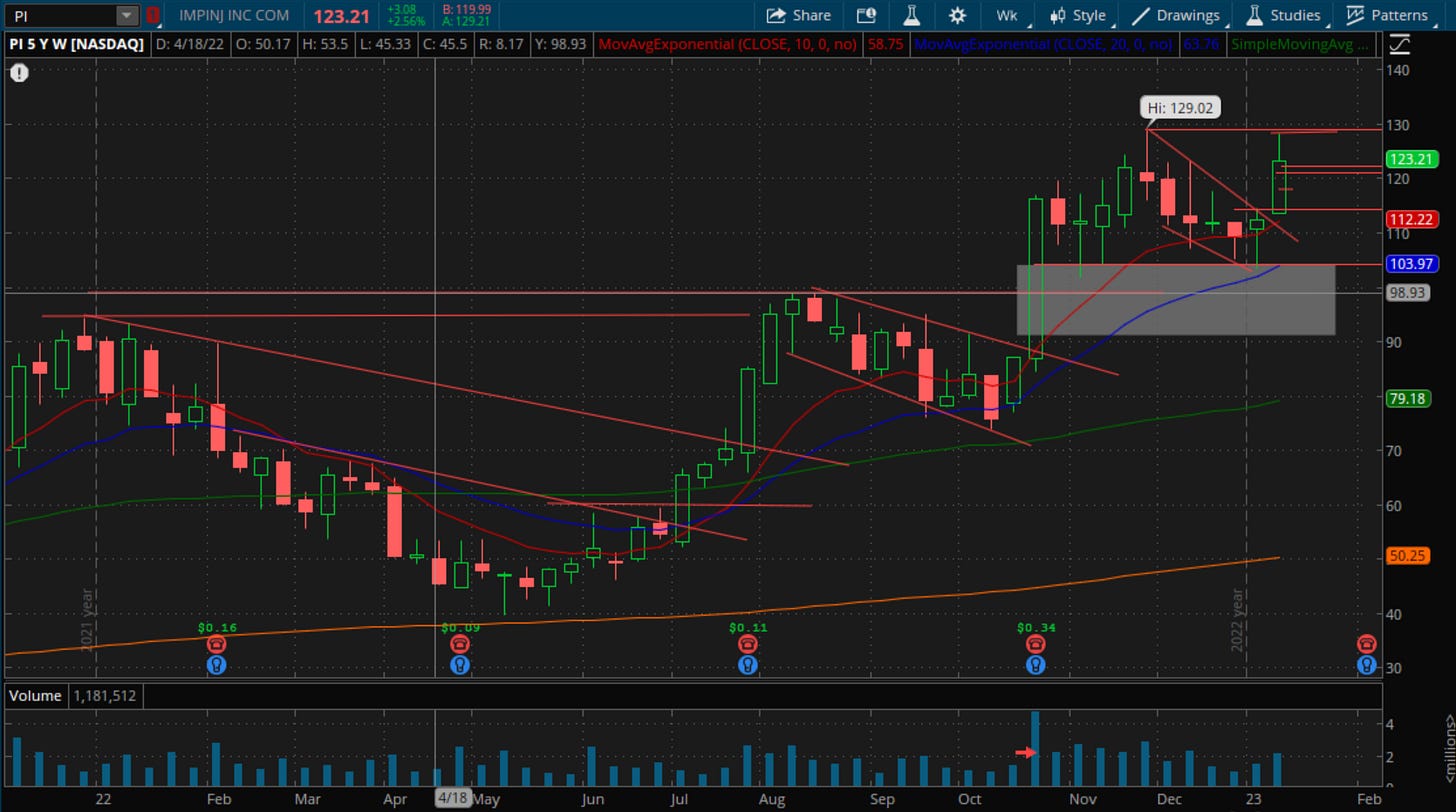
PI Weekly-pre-announcing raised guidance this past week. PI has shown relative strength the last 6-12 months. Broke out of a weekly bull flag last week as it attempts to push new highs.
TGLS Weekly-another play on South America. Three straight quarters of accelerating growth and a 12 P/E.
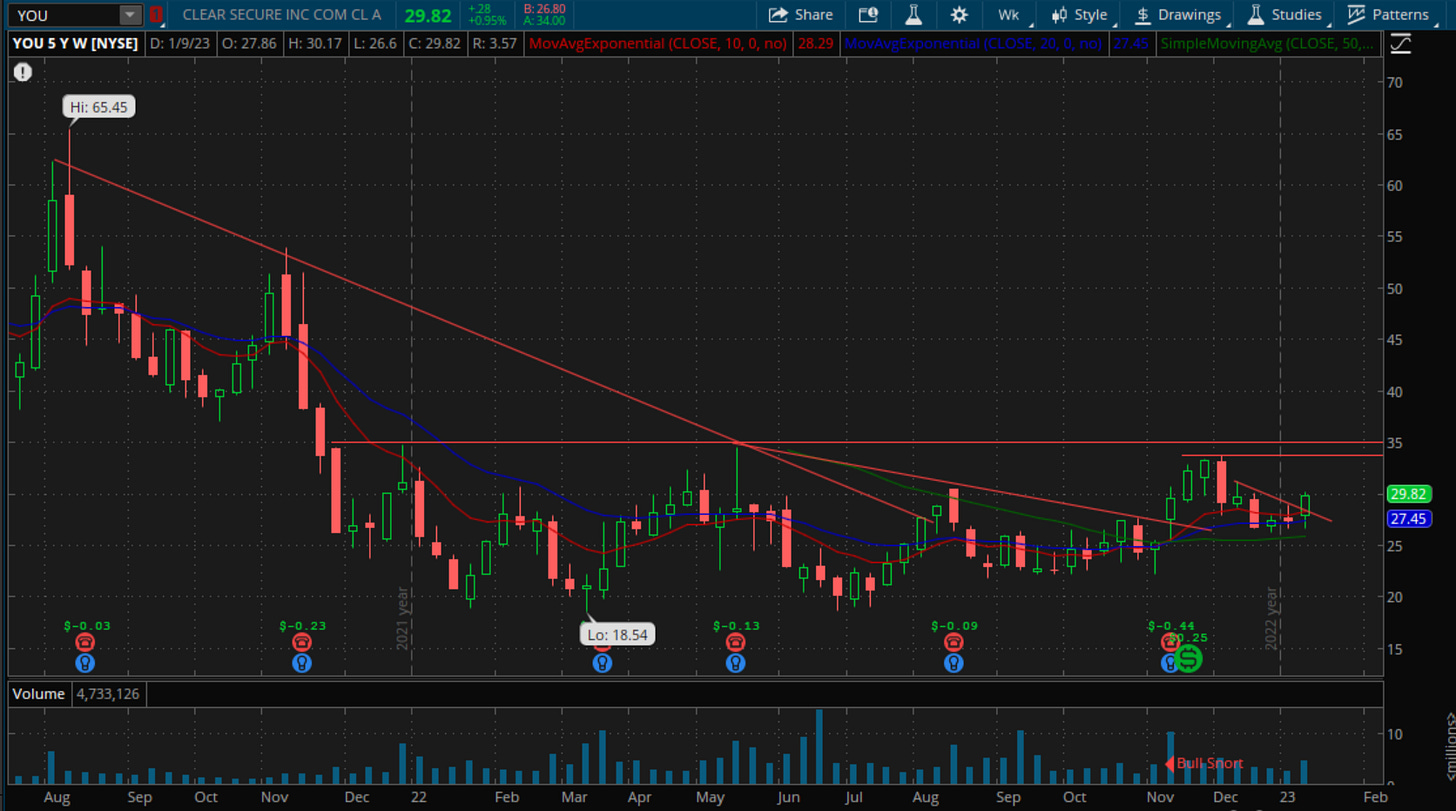
YOU Weekly-developing weekly with key levels at 34 and 35. Two higher lows off the bottom with strong support three times at the 20 level.
DGII Weekly- ignoring the indexes since clearing the 26 level in July of last year it has put in its first true pullback/basing pattern and may be setting up to turn back higher again. Clearing the 37-ish area could get it moving back up.
BE Monthly-needs to tighten up in the short term but large monthly cup and handle building and could be setting up to launch. Possibly with some sort of catalyst.
MEDP Weekly- major change of character bar in October on its earnings report. Continues to find support at the earnings bar lows (daily) and may be setting up to turn higher out of this consolidation.
MELI Weekly-large inverted head and shoulders pattern with a heavy volume up week this past week on advantageous news. An already exciting long term growth story may have just caught a greater tailwind.
FIVE Weekly-pushing off the 10 week and through the 188.50 horizontal level
NVDA Weekly-one of the big winning stocks of the last few years that took a beating this past year has built out an inverted head and shoulders pattern the last six months. Holding a higher low last week with the neckline higher around $188 or so.
HES Weekly-breaking out of a 2-3 month consolidation this past week. XOM CVX also setting to breakout of bases.
SLB Weekly-oil service stocks are the strongest sector in the oil patch with SLB and HAL being the two major liquid leadings names in the space.
CHX Weekly-a younger oil service stock with a constructive weekly chart. It cleared a long descending trendline on heavy volume in October, and broke out of a two-month weekly bull flag last week. 33 is the next resistance level to take out.
DE Weekly-with CAT already leading higher DE looks setup to trigger this weekly bull flag through 440 en route to new highs through 450.
PCAR Weekly-a 5-6 week weekly bull flag triggered this past week. Looks good for higher prices as transports and industrials perform well.
CMI Weekly- clearing a bull flag this past week, Cummins looks poised to make new 52 week highs through the 254 area.
NUE Weekly-explosive move this past week as it pushed out to new relative highs. Probably better to watch on a pullback or rest at this point but steel stocks look back in play starting off the new year.
STLD Weekly-very constructive weekly chart as Steel Dynamics pushed out of a weekly bull flag this past week. Some consolidation here at all time highs could set a new potential buy area.
ETSY Weekly-two definitive higher lows since bottoming out six months ago. ETSY appears to be one of the more constructive looking “growth” names of old. $125 and $142.50 the short-term levels of note.
Z Weekly- breaking out of an inverted head and shoulders pattern this past week on heavy volume. The leader of the real estate/tech stocks looks like it could be in the beginning phases of a new up move.
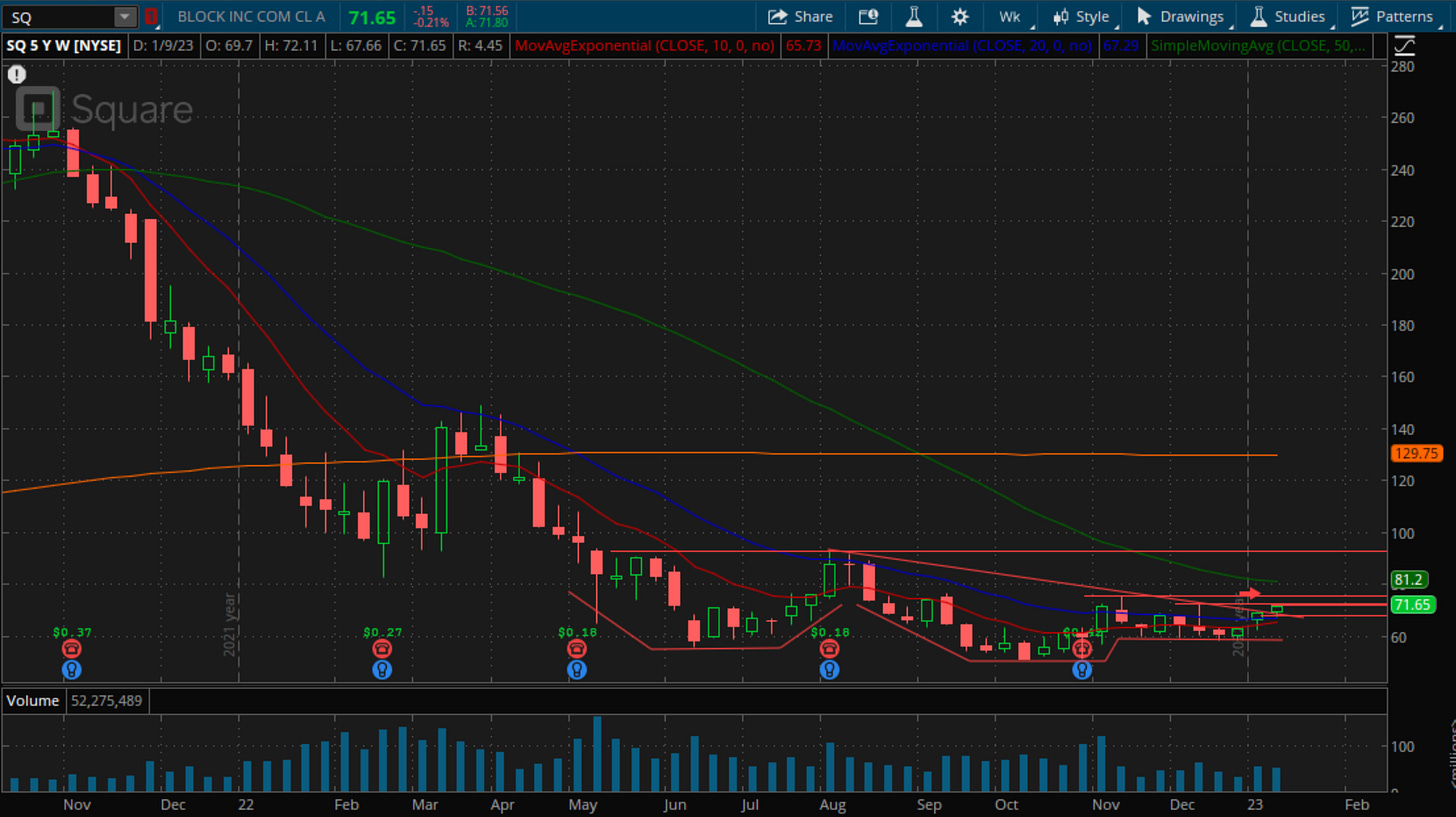
SQ Weekly- developing inverted head and shoulders pattern. $72.50 and $75.77 the near-term levels of note. It has a declining 200 period moving averge at $75 to be aware of as a net negative. Z had the same and blew right through it once it triggered its pattern.
SHOP Weekly-a former darling growth stock absolutely destroyed during the bear market could be building an inverted head and shoulders pattern with a neckline in the $45 range. Near term it is attempting to push out of a 5-6 week descending channel/weekly bull flag.
GLBE Weekly-a beat up name that could be showing signs of bottoming in this range. It is short term extended up into its daily 200SMA but some backing and filling could help set a buy area if you believe in the potential growth story.
PODD Weekly-early November day to take note bar that continues to consolidate. This is a thin/choppy stock that has not shown much power but has a healthy bigger picture pattern.
SWAV Weekly- former growth darling that eventually succumbed to the bear market weakness. Sort of back-testing its magic line breakout line. It seems to be getting some supportive price action and could see greater momentum above the 210 area.
AAPL Weekly- Losing a rising trendline four weeks ago appeared to be a significant breakdown. Drawn another way we may have just tested the broadening line in a developing large descending channel pattern. My hunch here is that the latter will prove to be the case. Either/or an index leadership name. If it were to bottom out here would be healthy for the underlying market.
TSLA Weekly-the darling liquid growth stock of the 2020 bull market that has completely blown out the last few months. Put in a reversal bay on 1/6 and is now consolidating under 125ish and the 20EMA. This is extended down from the 10 week and could easily see it snap back. There is a lot of volume at 125/126 we need to takeout.
OTHER NAMES OF NOTE
AXON, IRDM, KLAC, FLYW, ONON, TOST, SCCO, FCX, CMC, WYNN, RMBS, LSCC, MBLY, FN, AA, INSP, IBKR, BOX, SANM, FICO, WHD, ASO, AMBA


