I hate being negative on the market as people get mad about it. There is so much more anger, emotion, and frustration. The reality is….I am not bearish. The 10/20 moving averages are going down and my system says we are in a down cycle. That is it. If you didn’t read last weeks report go read it as most of it played out and I am not going to review it all. At present, the big concerns I have bigger picture are where many of the leading stocks resisted into the 2021 topping patterns and the continued lack of setups. On the positive side, this 20 Week EMA area is usually what holds the market in weekly uptrends so we will see if that (even if a little lower) can start to show supportive action. The second/third week of October is usually where we see the seasonal bottom and I have never seen seasonals play out so accurately as this year. I will review my core stocks and then go through what I would need to see to turn me positive on the market later in the report.
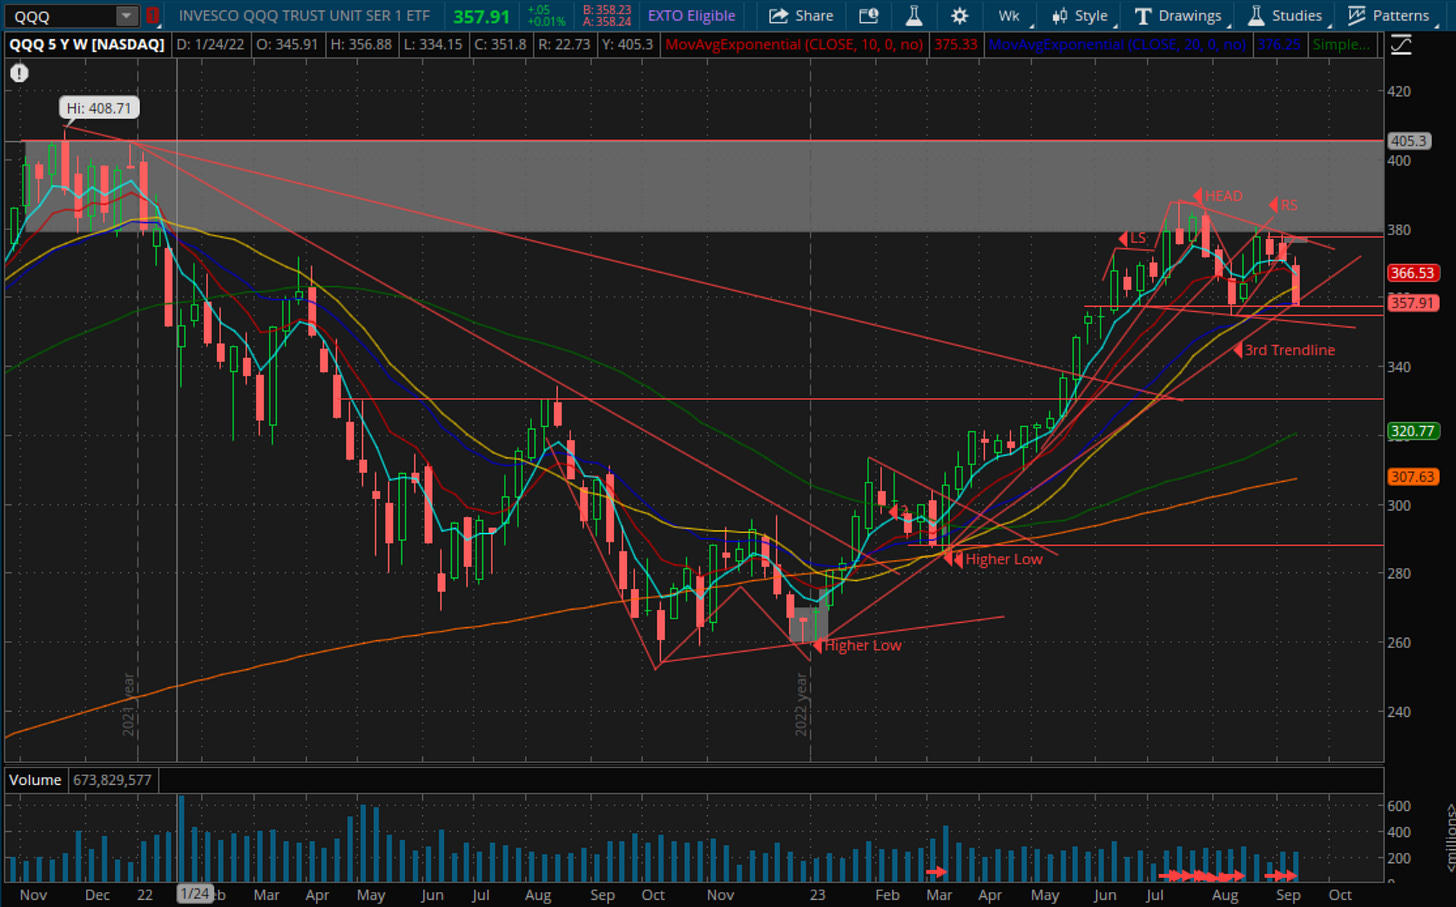
QQQ Weekly- Broke the 1-2-3/flag like pattern and now on the 20 Week and head and shoulders neckline around 357.50. We resisted right at the 2021 topping base. If we are going to stay in a real uptrend this general range/area of the 20 Week is around where we should hold. If we really broke the head and shoulders top a test of the previous base breakout is about where we would measure to.
QQQ-Another big unfilled gap down this week with the inability to rally. Short term stretched so could rally back but will look for the moving averages to resist price on rallies. The volume patterns continue to be very ugly so would think we will see some accumulation of some sorts to put in a low. From a risk/reward perspective, stretched down into support is less favorable for new shorts until we see some consolidation.
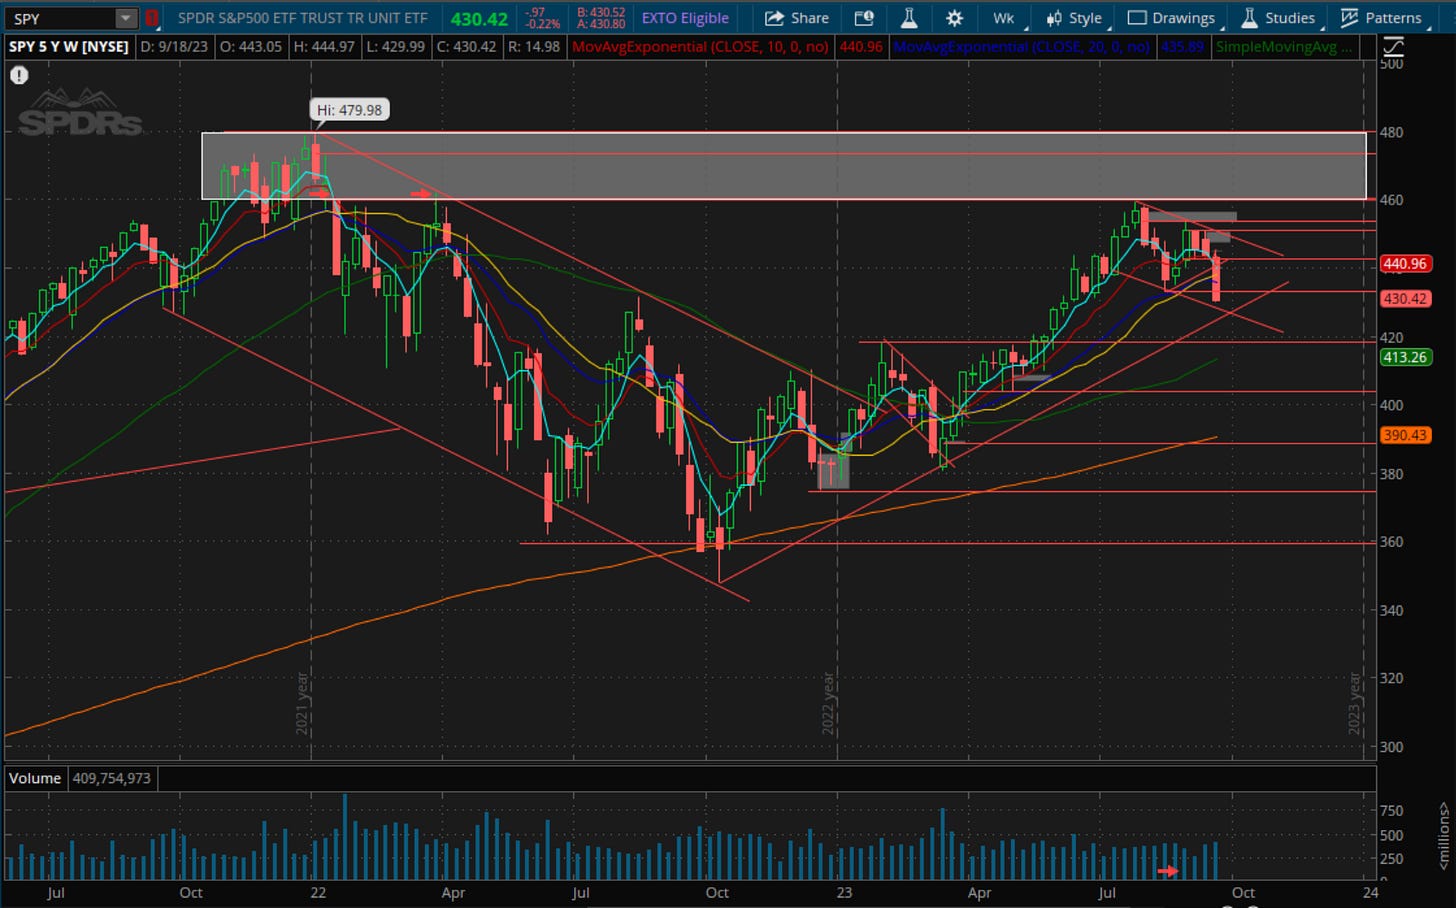
SPY Weekly-Resisting right at the 2021 topping pattern and now a lower high in August/September vs the July top with a more defined breakdown this past week. Losing the 20 Week EMA. I will show the SPY Daily further down the report and draw out what I would need to see to change my sell signal.
IWM-No one was more wrong than yours truly with a scenario for the IWM. My scenario has been completely scrapped as a failure. I will assess the action at this rising trendline but view the Russell as a distraction at present.
NASI-Tried to flip positive at the end of August but rolled over and seems to be accelerating to the downside. To flip positive, we need to see NASI flip black with CONFIRMATION above the 10EMA.
SMH Weekly-Closing below the 143 double top neckline and below the 20 Week EMA. 161-135=18, 135-18=127. That 127 level matches right up with the previous breakout area from May. I will trade my system but that’s where we measure to.
XHB Weekly-Closing below the double top neckline and below the 20 week with authority. 85-78=7, 78-7=71. This measures to 71. The previous breakout/support area is at 72 and also lines up with the 200SMA.
10 Year Yield-Weekly breakout of this year long pattern after triggering the descending channel at 3.8%. Looking at the moves from January to May and August to October they were both about 1.75%. If we go to May 1st (current move lows) the 10 Year was at 3.3%. If we get a similar move that would take us to about 5%. Is that technical analysis? I have no idea but I noticed the symmetry in moves so we will see.
HYG Weekly- High yield is a risk on measure and looks vulnerable to lose the 74/73.50 area. Will use that as a tell if it happens.
AAPL Weekly-173.50 has held for three straight weeks. Does it hold next week?
AAPL Daily- Big gap down on earnings, rally up and rejection at the gap area, and now we are basing on the lows. This cracks 173.50 and will be the first of the liquid leaders to put in a lower high and lower low on the weekly. Bulls need it to make a stand here or fake down and recover. My 10/20EMA rejected price last week and is converging down going into next week. We either break up through the 10EMA or drop 173.50. No need to have an opinion. Just play it as it lies.
MSFT Weekly-Failed breakout and broke the rising 1-2-3 pattern showed last week while closing below the 20 Week. Will it make a lower low on the weekly?
TSLA Weekly-The weakest of the big cap tech stocks this year is it was never able to attack the 2021 highs (not even close). Bearish engulfing weekly bar this past week with a lower high in the near term against the July high. Have shown in the past how important the 50 Week/200 Day moving average is for this stock so will remain neutral bigger picture as long as we are above there even though on a daily sell signal.
TSLA Daily- Unable to overcome the huge gap resistance from earnings TSLA broke this rising channel Friday. It looks set for lower prices to me as long as stays below the IGNITE bar high of day from Friday.
NVDA Weekly-The leader of the market this year approaching the 20 Week. I am torn here as it still shows higher lows since the May earnings and is three straight weeks down….just going to see what happens here.
NVDA-Broke the trendline from the May earnings this week but had a subtle unfilled gap Friday. On a sell signal and guilty for me. I was late in shorting those so covered the majority of my short. Just going to observe until I see a high conviction play.
AMD Daily-Lost the trendline from the lows this past week and at an absolutely critical point after breaking the 100 horizontal level. Can the 200SMA save this? If it did, maybe this huge descending channel sets up…..but on a sell signal for me currently. Would LOVE to see this channel set as could lead to a big trade.
AMZN Weekly-From failed moves come fast moves. Failed breakout and rejection into the huge 2021 topping base followed by a nasty bearish engulfing bar. Action like this needs time to repair at best in my experience.
META Daily-I still see a head and shoulders top here despite the relative strength. I got stopped on it this past week but still think this is an opportunity short. Closer look at the 195 minute. Wide/loose action like this just spells trouble in my experience.
META 195 MIN-I really went through and broke all the volume down. I just see sell side volume despite the relative strength. Specifically, huge volume off the top on earnings…just like NVDA. Then it had chaotic insane volume day on 9/7 just like MSFT/AAPL into their tops. Crazy wide and loose this past week….BUT also a lot of relative strength. META conference on 27th/28th. 92/93 area is the major inflection point. If the market were to base, rally up would want to see this show relative weakness. If it took out the chain of three lower highs recently then thesis wrong.
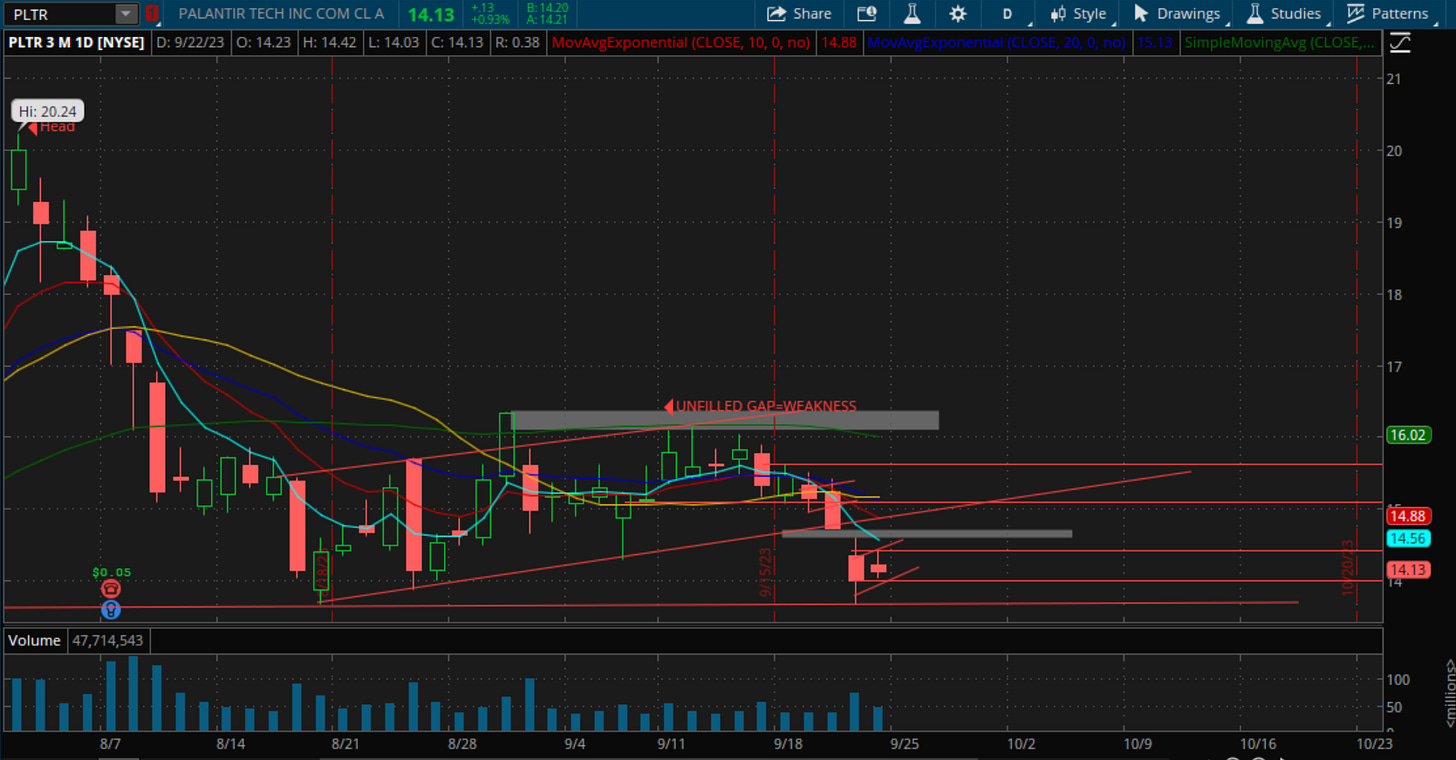
PLTR-Supporting on the head and shoulders neckline. EMAs coming down. Lets see it they can push it down for the break.
SNOW Weekly-If lost this weekly trendline chance to turn into a real trade. The entry on the daily was 2-3 days ago but think worth keep on watchlist if market stays week.
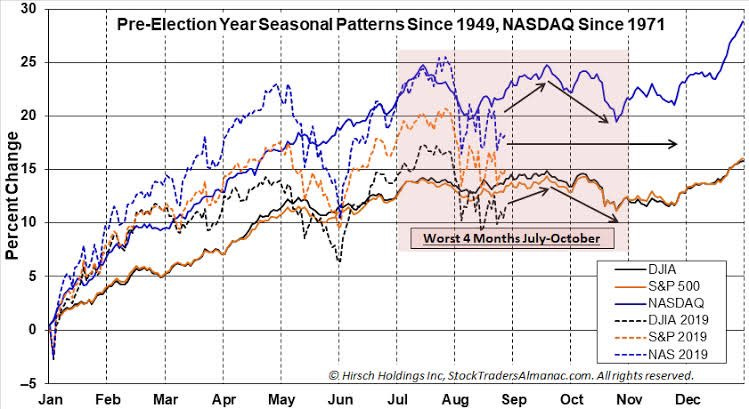
Seasonality has never been more accurate than it has this year so I think you would be stupid to not be aware that seasonally we bottom in October and have a strong year-end rally. A small bump at the beginning of October with a continued sell off into the 2nd/3rd week of October and then a rally. I have no opinion on whether this plays out or not but know my system will get me long if it does.
What would I need to see? I put a scenario below on the SPY and will explain it the best I can. More important than this I would want to see the stronger names develop nice patterns into the final weeks of weakness.
SPY Daily Upside Scenario-We have currently undercut the August lows in the SPX-500 and are stretched to the downside from the 10/20 EMA. There is no base or supportive action to show a reversal….and few to no setups either (most importantly). Taking into account the seasonals from above in conjuction with having traded my strategy for a long time maybe it could play out something like the below? Is this a prediction…..absolutely not. Strictly a scenario that I currently see zero evidence of. We will need to see basing action and a reversal in the very negative volume patterns we have seen since the July top. MOST IMPORTANTLY!!!!!…..we will need to see stocks start to set up in healthy basing patterns. At present, I see very few and on the weekly charts I have concerns with where we resisted. I will trade the sell signal until further notice and adjust when/if we get a buy signal.
As far as stocks showing relative strength…..a few below. I am continuing to avoid long swings until I see a major capitulation reversal extension in the QQQ or we switch to a buy signal.
AKAM-Impressive breakout and tightening action the last few days. The CEO has made a bunch of recent purchases. In a better environment I certainly would have bought this stock.
ESTC-Strong bid, possibly cause of the SPLK buyout, but strong bid none the less. Excellent earnings the past three quarters too.
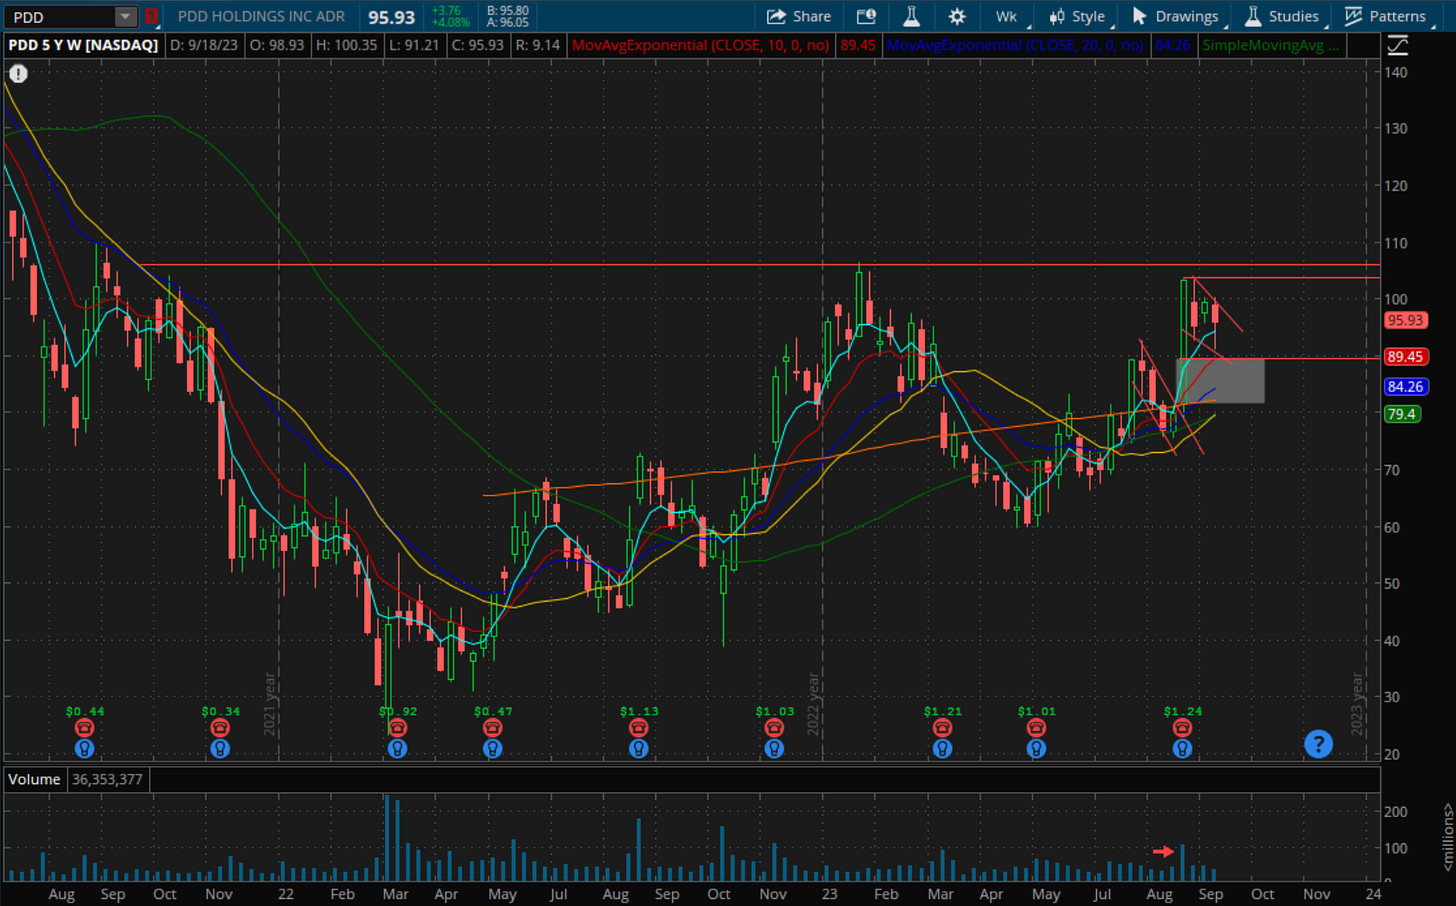
PDD Weekly- Strong earnings report and consolidating nicely. The TEMU app is hot. I have no intention to trade it as its a China stock but acting well.
VRT Weekly- Lost momentum on the daily timeframe and think it would actually set up better with further market weakness (if it held in).
DELL-Consolidation nicely since its monster bull snort. ANF in a similar boat.
FN Weekly-Looks very good and consolidating nicely at all-time highs. Low ATR for an illiquid-like name but strong.
CAMT Weekly-Very strong stock that might be served will with a few more weeks of consolidation.
CWAN Weekly- Strong stock working up the right side.


