Overall, the market continues to be a chop/consolidating tape with two inside weeks. We saw a heavy distribution day on Friday but basically haven’t moved in three weeks. Friday was a quad witching day that can lead to some false moves so its possible things just repair next week. However, scanning the entire SPX and NASDAQ things mostly look distributive to me. I am going into the week with some long and short setups but definitely have a caution flag up. The weakness in semis and homebuilders combined with a lack of setups and interest rates on the cusp of breaking higher has are driving that caution.
QQQ Weekly-July top occurred at a huge level of trade from the December 2021 high. Currently we are “potentially” putting in a lower high vs the July high but need to see which way these inside weeks go (370.31/378.27 x 369.15). If we take the lows of the inside weeks my major reference point is the 20 Week EMA and 357.50. The 20 Week is the most important reference point for me on the underlying weekly trend.
QQQ Daily- Losing the 9/2/2023 low at 369.15 low would be the first chance to break the trend back down since the rally from mid-August began. We closed two of the open gaps this past week but opened another on Friday and put in the third lower high since topping in July. There is also a head and shoulders building. The right shoulder back-tested and rejected the second trendline I have shown.
SPY Weekly-The July top also resisted at the January, March highs. Very similar to the Nasdaq. 44.275 and 442.92 are the inside week lows. with 451 area to the upside.
SPY Daily-We resisted at a similar large open gap/resistance. If we follow through down next week this lower high vs. July would be confirmed for me. The next level to watch would be 433.
IWM Weekly- Laid out a potentially bullish scenario on the IWM a few weeks ago. Needless to say….it has not played out as expected. Despite the weakness, nothing has changed and the scenario below could still be in play. Holding the 200SMA (on the daily) is key and if we lost that my thoughts are likely wrong.
TNX Weekly-Interest rates have been in a year-long consolidation but broke out of a weekly descending channel at 3.86%. The Fed is Wednesday but this chart looks higher to me. That would be a negative for equities for me.
SMH Daily- Highlighted this 152.25x149 area on twitter and we triggered short down. The semis led the market higher and look to be leading lower. Scan through some of the following names as many look headed lower to me. Chip stocks really look like they are in rough shape. TSM TXN KLAC LRCX ACLS AMD AMAT ASML ON MCHP NVDA RMBS
XHB Weekly-Homebuilders were the second leading sector in this rally higher. They are in a 10-12 week consolidation and approaching the 20 Week. This is the key weekly timeframe measure of trend for me. Watching what happens here. (LEN got bought up on volume Friday….follow through higher vs rolling back over would be great to see). Ig XHB can hold this 20 Week it could develop a nice big handle.
MSFT Weekly-Failed breakout on the highs and now a potential lower high. There is still no lower low and the 20 Week is there. Very important to me what happens here.
AAPL Weekly- Hard break off the top, rally back, and rejection at the large open gap on the daily. AAPL is at an important spot as it has the potential to make a lower low on the weekly if we follow through down. As the largest market cap company in the US what happens here (on a weekly closing basis) is very important. Some reports of strong demand for the iPhone 15 hit over the weekend and can possibly be the catalyst to defend this level?
TSLA Weekly- Relative strength Friday. We have an enormous unfilled gap overhead on the daily time frame (similar to April/June 2021 patterns highlighted on twitter). If this can get through that I think this has enormous potential if it can setup 300. If the market were to weaken it could be setting up a near term lower high within a larger pattern of lower highs. I am willing to be patient and buy it higher as think through 300 is where it can really open up on the long side.
NVDA-The leader of the market this year. I spoke in depth about the 3-push pattern from May through July and all the distribution pre and post earnings so won’t go through it again here. Resisting at the 20EMA and following through down Friday. 400 is the next support level.
META Weekly-Looking left to late 2021 shows we are resisting where it previously broke down. Last weeks candle shows the potential for a lower high to develop? This looks similar to the NFLX weekly to me. Do we follow through down or was Friday an opex aberration?
NFLX Weekly- Rejected at the consolidation through the first half of 2021 that preceded a blowoff top in this stock. Now selling on very poor price action. We have held this trendline off the lows so not completely broken yet. Key area.
AMZN Weekly-Looking left we are right into the resistance area that led to this stock topping in late 2021/early 2022. With GOOG it has been the recent Big Tech leader. Do we consolidate and take this area out or resist?
AVGO-If you look at the weekly this has probably been the strongest of the semiconductors as of late. But are we setting up to break? A few things I see. The massive volume reversal in May was the first sign of distribution. I put arrows on three other heavy volume down days since. We also have an unfilled gap down post earnings (weakness) and are sitting on the neckline of a head and shoulders/double top-ish pattern. It has a support gap below.
SMCI-A leading stock that rallied 400-500% this year depending on how you view it. Monster gap down on earnings with a downside short sell trigger on Friday. Could it hold this 240 support area….sure….but at present it looks more negative than positive. Not a great sign when the leaders of the move start to trigger as shorts.
PLTR-Unfilled gap and resisting at the 40SMA in this potential head and shoulders. Would need to break this rising channel. Would re-assess if took out the 50SMA.
TAN Weekly-The solars are the weakest sector I see. Do we continue lower through these lows? ENPH has been bludgeoned. FSLR is the leader and is sitting on support.
PAYC Weekly-Do software stocks like this break these key support levels in the making over the last year? Not necessarily one to short but if we start to see stuff like this flush you have to take note. A tell for me.
Despite the red flags I see in the semis, homebuilders, and the areas we are up into on Big Tech there are some stocks acting well. Below are some strong names I am tracking if what I highlight above is all smoke and mirrors. Additionally, if the market pulls in a little bit it could really help set these up.
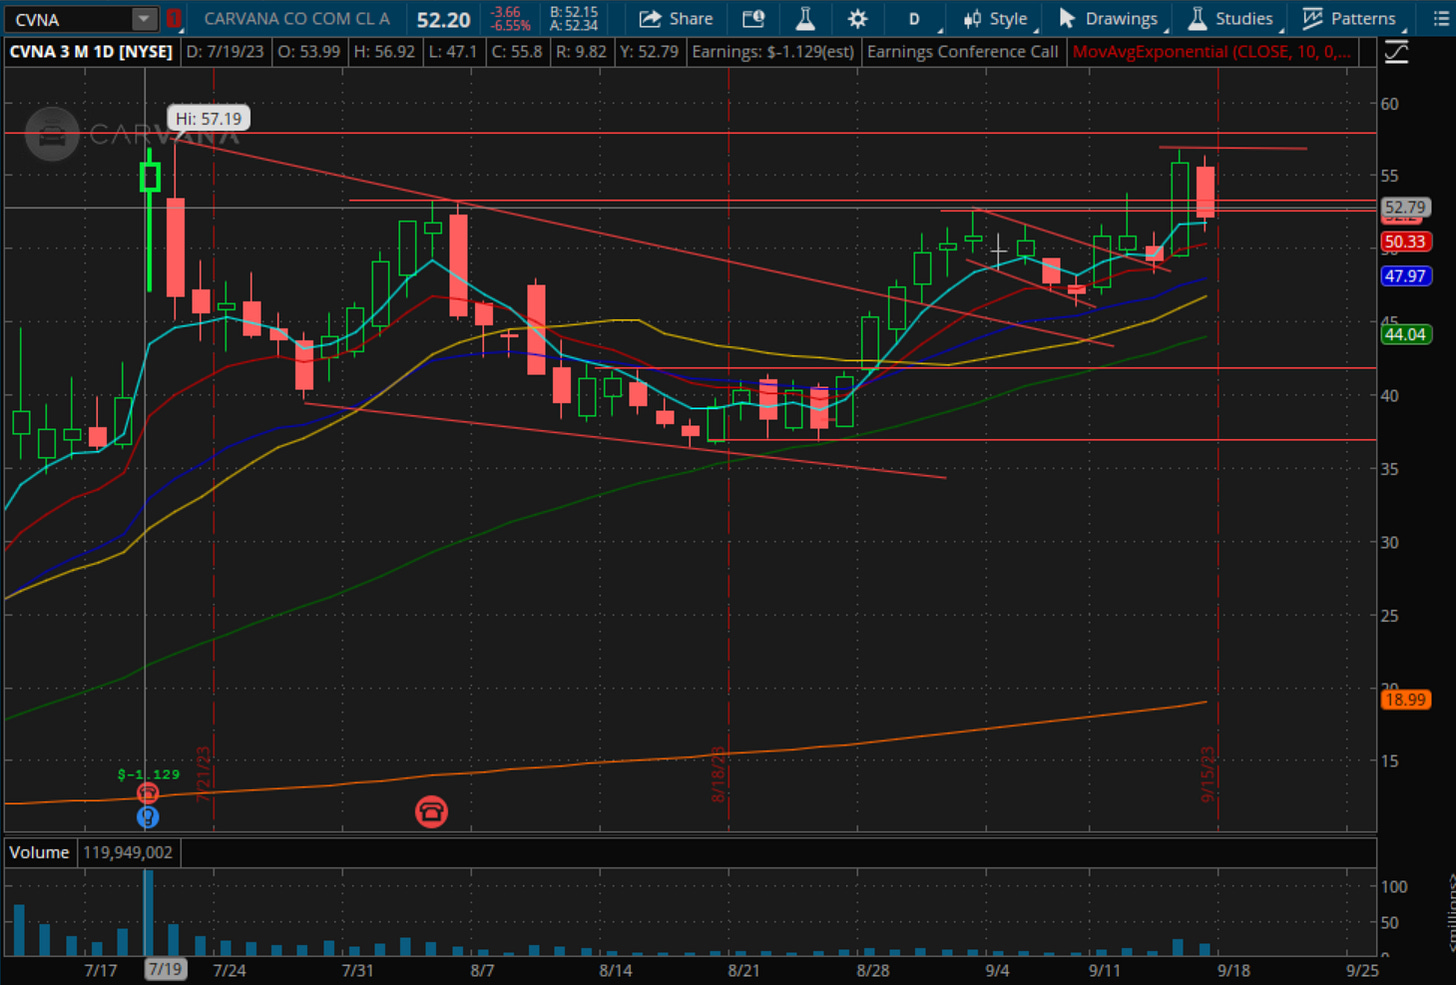
CVNA-Inside day at the 52.50ish area we pushed Thursday. It has respected the 20EMA and that is my key area if go back to see previous rallies. If we can hold in here and take 57/58 it could really fly.
COIN-Showed this with the bitcoin weekly on twitter last week. Gold stocks (specifically AGI) actually seem to be perking up. 86.50 is the near term level in this potential inverse head and shoulders bottom.
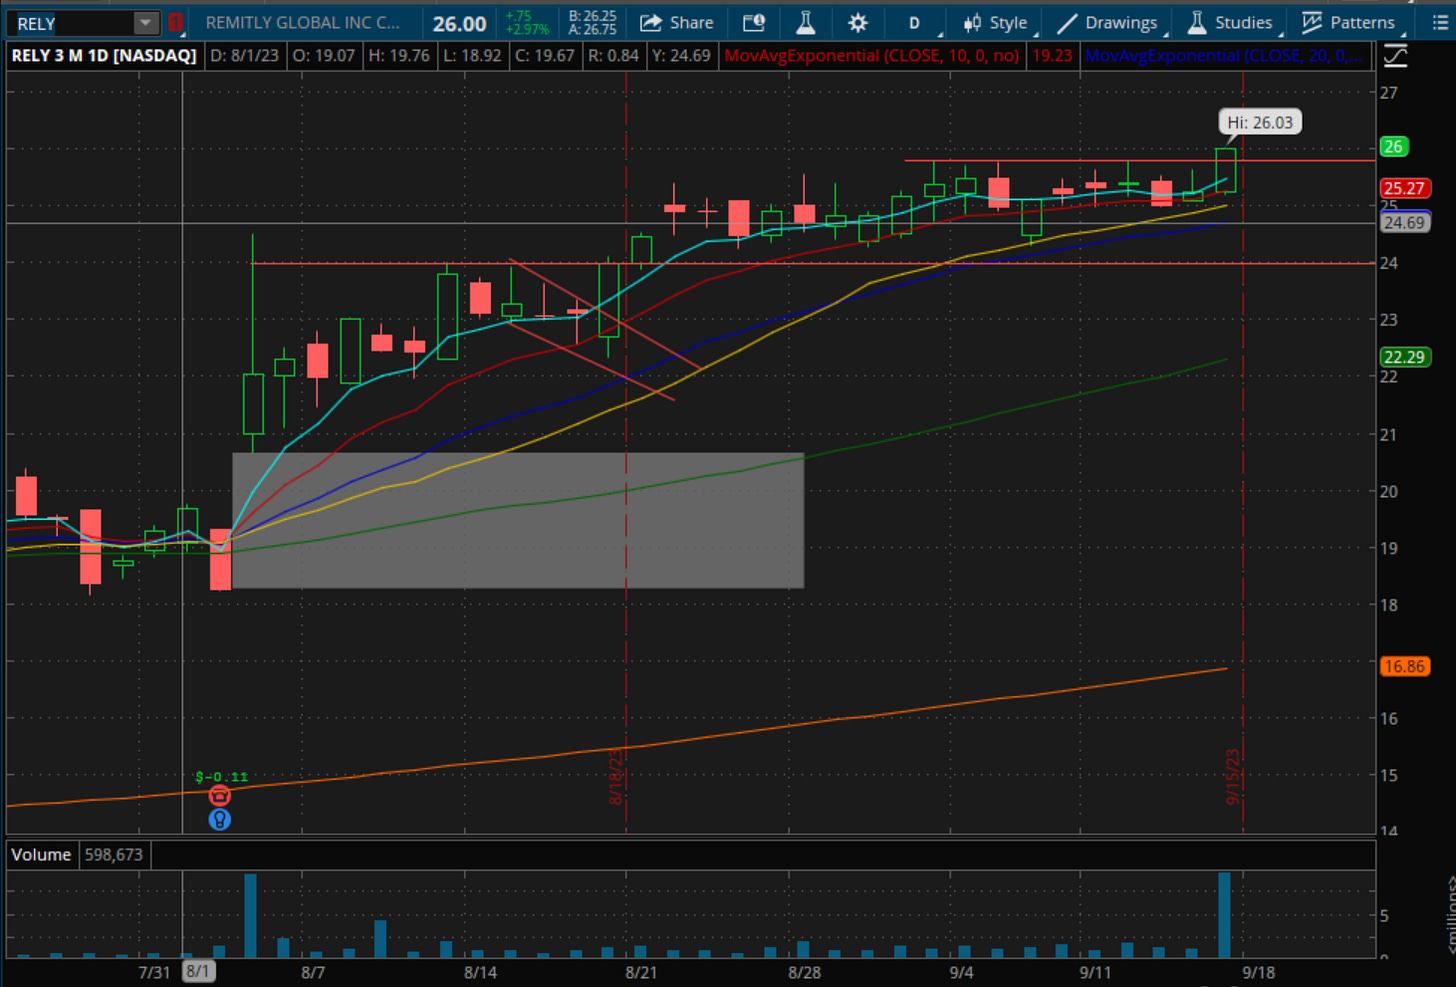
RELY-Super strong actually breaking out on Friday. A very thin stock though.
VRT-Acting exceptionally well as build this new consolidation.
CELH-Extended on the weekly but if it can build a new consolidation into the 20EMA over the next few weeks it could set a new buy area.
SPOT-Great relative strength Friday. Think it will need the market to work higher in a major way.
APP-Great relative strength Friday as the 20EMA is caught up in this pattern.
IOT-Back-tested the magic line with a strong bounce Friday. Like the weekly but happy to wait to see how this builds out. The two unfilled gaps tell me it could chop more and build a better pattern.
Others Watching: ESTC RIVN SHOP DKNG AEHR ABNB UBER ANF SPLK AFRM


